Archive: Normativ modeling
This toolkit automatically analyses brain functional connectivity based on resting-state fMRI data (rs-fMRI) and identifies deviations from a “normal” reference model, in order to highlight alterations associated with psychiatric disorders and chronic pain. The system builds a reference model of how brain networks interact in healthy subjects, then compares patient data against this standard to detect abnormal connectivity patterns. The primary goal is to support the discovery of objective neuroimaging biomarkers that could contribute to more precise diagnosis and personalised medicine.
Raw fMRI data are processed through a complex preprocessing pipeline:
-
signal cleaning, physiological noise removal and motion artifact correction (Fig. 1)
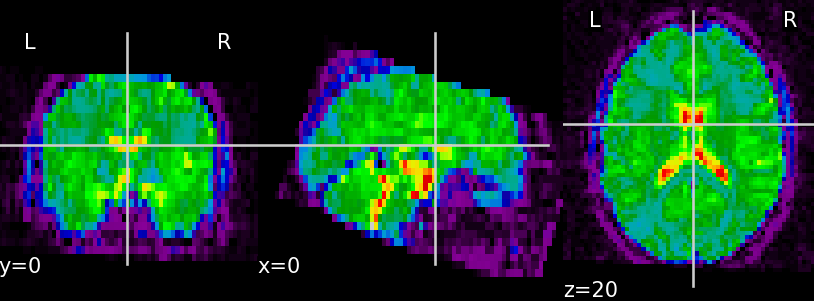
(A) 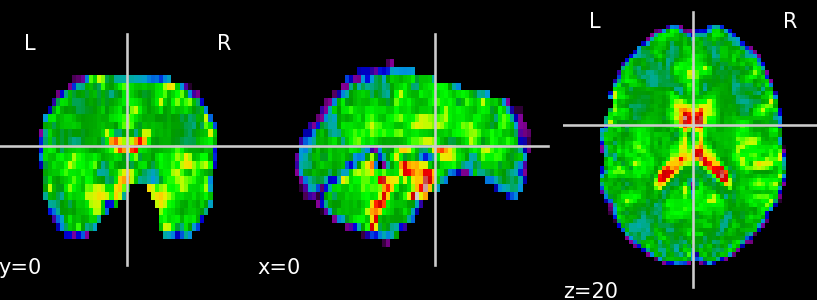
(B) Fig. 1. Unprocessed functional data (A) and functional data after the preprocessing step — skull stripping, confound removal, low- and high-frequency filtering (B)
-
brain parcellation into standard functional networks using different Yeo atlas variants (Fig. 2)
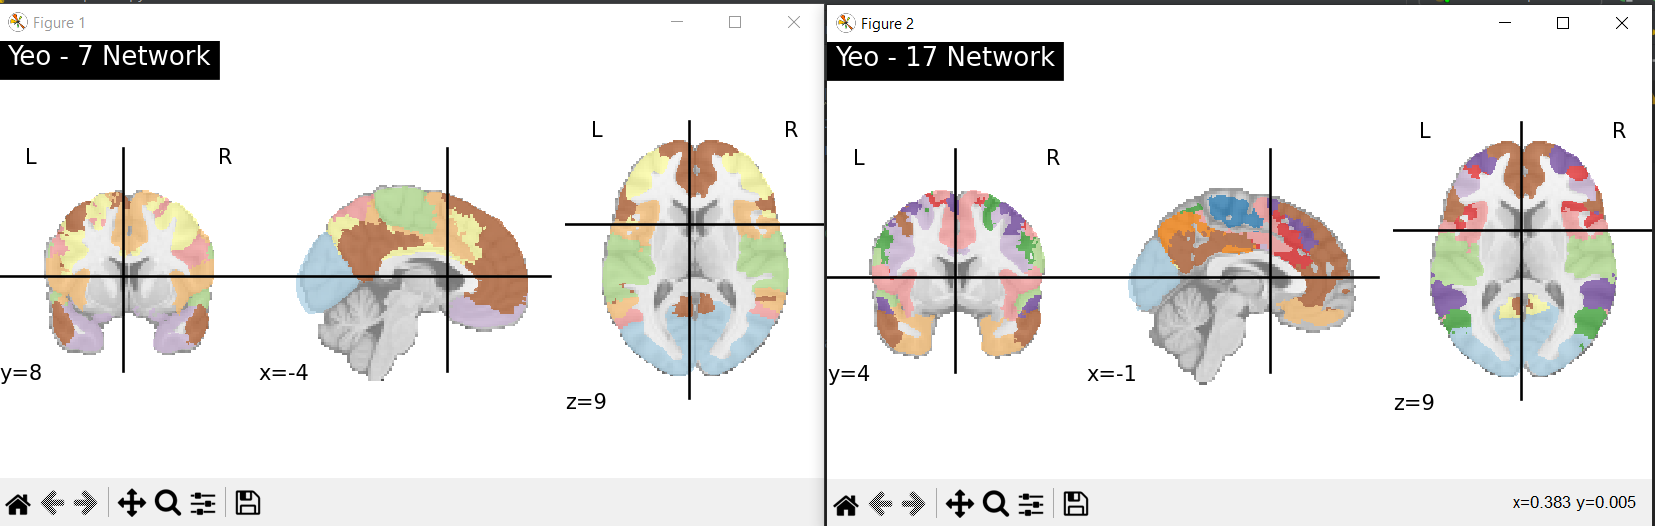
Fig. 2. The Yeo Atlas (Yeo-7 Network and Yeo-17 Network)
-
computation of functional connectivity matrices between these regions (Fig. 3)
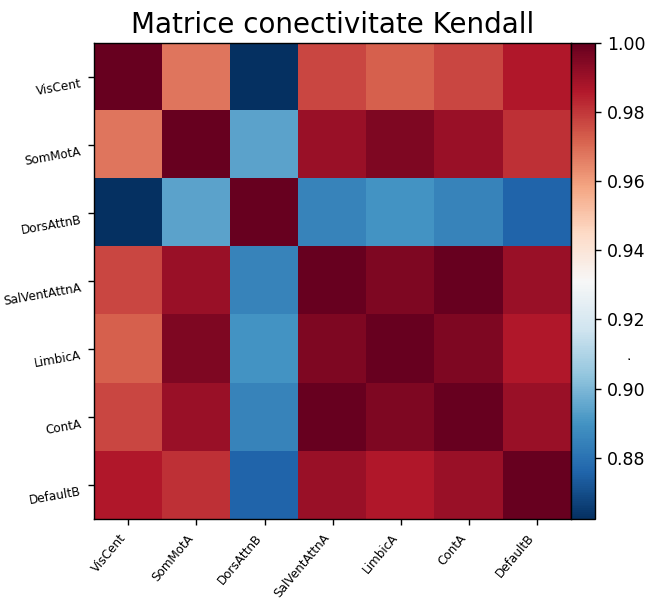
(A) 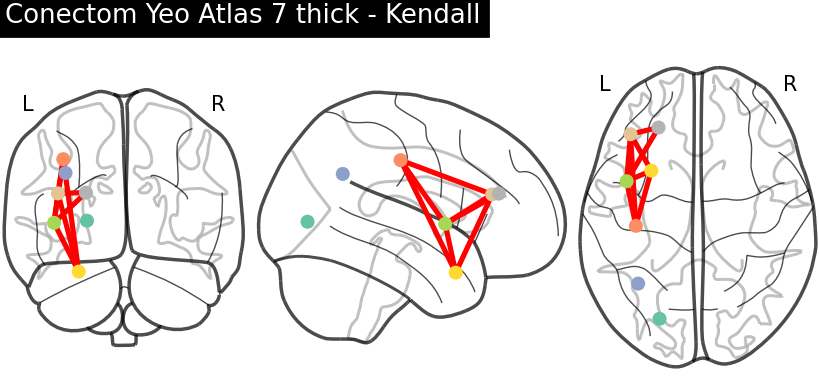
(B) Fig. 3. Connectivity matrix (A) and connectome — most relevant connections (B), after applying the Yeo 7 thick atlas and using Kendall correlation for functional connectivity estimation
Based on these matrices, the system extracts numerical features describing interactions between brain networks. These features are then fed into a normative encoder–decoder model (neural autoencoder, Fig. 4), trained exclusively on data from healthy subjects, so that the model learns the normal pattern of brain connectivity.
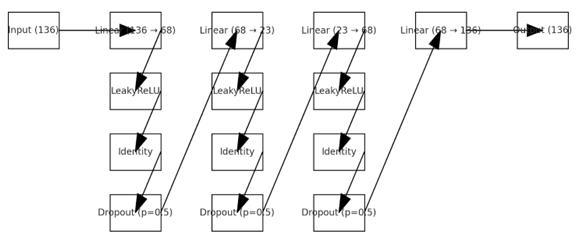
Fig. 4. Normative model architecture (encoder–decoder MLP: 136 → 68 → 23 → 68 → 136)
After training, the model is used to analyse participant data by computing the reconstruction error. If certain connections between brain networks are poorly reconstructed (high errors), these are considered deviations from normal and may indicate functional alterations associated with neuropsychiatric conditions or chronic pain. To ensure robustness, multiple preprocessing variants and connectivity metrics can be tested, automatically selecting the model that identifies the most stable and reproducible anomalies.
An interpretable analysis of abnormal brain connections can be performed, highlighting both disorder-specific differences and mechanisms shared across conditions. This approach goes beyond traditional symptom-based classification and enables the identification of quantifiable neurobiological patterns, opening the possibility of integrating the system into future clinical decision-support applications and personalised diagnosis in psychiatry and pain medicine.
This repository implements the workflow described in article [1]. Starting from fMRIPrep derivatives (resting-state), the pipeline produces:
- atlas-based functional networks with associated mean BOLD time series — per subject (one matrix: T × Nnetworks)
- optionally, functional connectivity (FC) features computed from these series (e.g.: Pearson / Spearman / Kendall)
- normative deviations for each FC functional connection using an MLP encoder–decoder (autoencoder) trained only on healthy controls (reconstruction error = deviation score).
1. Installation
Option 1 — pip in a virtualenv
python -m venv .venv
source .venv/bin/activate # Linux/Mac
# .venv\Scripts\activate # Windows PowerShell
pip install -U pip
pip install -r requirements.txt
Option 2 — conda
conda create -n nm-fmri python=3.10 -y
conda activate nm-fmri
pip install -r requirements.txt
2. Input data structure (BIDS format)
Expected structure for each subject (or modify the code in preprocess.py):
<derivatives_dir>/
  sub-XXXXX/
    func/
      *_desc-preproc_bold.nii.gz
      *_brainmask.nii.gz
*_confounds*.tsv- Only single-session studies are currently supported.
- Confound names may differ — update them in utils/constants.py.
3. Main steps
3.1 Atlas time series extraction (dimensionality reduction)
Edit configs/preprocess_config.yaml (key fields: derivatives_dir, subjects, task, clean_arguments, atlas_type, atlas_args, output_path), then run:
python preprocess/preprocess.py --config preprocess_config.yamlThe output is a dataset_*.pkl file containing the mean time series of functional networks for all selected subjects.
3.2 Normative model training (healthy subjects only)
Edit configs/train_config.yaml to specify the .pkl train/val files, then:
python train.py --config train_config.yamlConnectivity features are computed during training according to configs/dataset_config.yaml (connectivity_measure_type). Training can be adapted for multiple models by uncommenting the final section of train.py.
3.3 Testing (deviation maps per FC connection)
Edit configs/test_config.yaml (model checkpoint + test datasets) and run:
python preprocess/test.py --config test_config.yamlOutput includes deviation scores for each subject and each FC connection (e.g.: MAE per connection).
3.4 Group statistics (connection-level p-values)
Computes statistics between control data and a target group:
python misc/postprocess_csv.py --input <path_to_results.csv>The script applies Mann–Whitney U tests for each connection; connections with p < 0.05 are flagged as discriminative between groups.
4. Reproducing the cross-dataset setup from the paper (UCLA → CPDS)
The paper:
- trains multiple models on healthy UCLA participants using different configurations (denoising × atlas × connectivity metric),
- selects a robust model based on stable significant connections,
- fine-tunes on a healthy CPDS subset before testing on chronic pain CPDS patients.
In this codebase you need to:
- prepare separate folders / .pkl files for (train, val, test) in UCLA,
- prepare separate .pkl files for (fine-tune train, fine-tune test) in CPDS,
- run training and fine-tuning as separate experiments, each with its own config.
5. Connectivity computation
After extracting ROI time series, functional connectivity can be computed independently using a configurable method. The data can be used to train other models (e.g.: SVM, RF) or for harmonisation, if data from different distributions are present.
python scripts/compute_connectivity.py --config configs/connectivity_config.yamlThis step:
- computes FC using a selected metric (Pearson, Spearman, Kendall, covariance),
- saves the lower-triangle vector (without diagonal) for each subject in a .pkl file, ready for normative modelling.
The resulting feature dimensionality is (N×N−1)/2 (e.g.: 136 for the Yeo-17 atlas).
6. Data harmonisation
If the data come from multiple different distributions, ComBat-type harmonisation techniques can be applied. This can be done with the script ajust_distr.py, into which the desired data must be loaded.
7. Utility scripts
7.1 Scripts for organising fMRI DICOM data as a BIDS database and preprocessing with fMRIPrep
Archive: DB organization from scratch to BIDS and fMRIPrep procesing
This toolkit provides a standardised workflow for transforming raw neuroimaging data recorded in DICOM format into a structured and preprocessed fMRI database, ready for downstream analyses such as functional connectivity estimation and normative modelling.
The repository contains utility scripts developed to automate the preparation of multi-subject neuroimaging datasets, starting from raw DICOM files and producing BIDS derivatives preprocessed with fMRIPrep.
The workflow covers the entire data preparation chain:
- DICOM dataset analysis and organisation (folder_to_participants.py) – DICOM data are consolidated into a .csv file required for conversion to BIDS format
- Automatic DICOM-to-BIDS conversion (to_BIDS.py) – the previously consolidated DICOM data are transformed into BIDS-format data
- Automated batch preprocessing using fMRIPrep
The result is a standardised, anonymised, and reproducible database, ready for functional connectivity analyses and advanced neuroimaging studies.
7.2 Scripts for preprocessing and statistical analysis of study data
Archive: Preprocessing data and statistical analisis for study
This archive contains a set of scripts developed for the standardised analysis of fMRI data before and after the application of an instantaneous experimental stimulus, within studies dedicated to oncological chronic pain.
The pipeline starts from fMRI data already preprocessed with fMRIPrep and enables:
- splitting the BOLD signal into PRE and POST stimulus intervals
- removal of confound variable effects via a voxel-level GLM model
- computation of functional connectivity across brain regions
- statistical analysis at the voxel and network level
- single-case versus control group comparisons
The scripts have a series of input/output parameters that must be configured before running (see comments in the files).
Main scripts:
split_BOLD_signal_ses_01.py
- automatically generates the experimental event
- builds the GLM design matrix
- splits BOLD series into PRE and POST stimulus series
- computes residuals per series
- produces quality control reports
pre-post_functional_corellation_matrix.py
- extracts time series using the Yeo-17 atlas
- computes functional connectivity matrices (Pearson, regularised Pearson, Spearman, Kendall)
- computes PRE-POST changes and Fisher-Z transformations
pre-post_stat_analysis_per_subject_voldes_visual.py
- performs statistical tests per equivalent voxel pair
- generates t and p maps
- produces PNG and interactive HTML visualisations
stat_analysis_p4_data.py
- performs single-case vs control group comparisons using the Crawford-Howell method
- applies FDR correction
- generates heatmaps and statistical tables of connections
Workflow:
- Preprocessed fMRI data (fMRIPrep)
- PRE/POST split + GLM
- ROI extraction and connectivity
- Statistical analysis
- Visualisation and biomarker identification
The scripts were developed for investigating brain functional reorganisation associated with oncological chronic pain and for the identification of neuroimaging biomarkers.
Bibliography
[1] Boldișor, DA., Udrea, A., Trăscău, M. (2025). Normative Modeling of Functional Connectivity Alterations in Psychiatric Disorders and Chronic Pain: A Resting-State fMRI Approach. In: Artificial Intelligence Applications and Innovations. AIAI 2025. IFIP ICT, vol 758. Springer, Cham. https://doi.org/10.1007/978-3-031-96235-6_13