This toolkit is designed to perform automated analysis of mammography images for the detection and segmentation of breast lesions (tumours). The primary objective is precise segmentation of breast lesions, with particular emphasis on images containing a higher number of nodules or nodules of smaller dimensions. A two-step pipeline has been proposed to overcome the limitations of direct segmentation on full mammography images (Fig. 1):
- Detection — used to localise regions of interest. A key implementation feature is the expansion of the detected region beyond the native bounding box, ensuring sufficient spatial context for the segmentation step
- Segmentation — applied exclusively to the cropped and expanded region, achieving significantly better precision compared to full-image segmentation
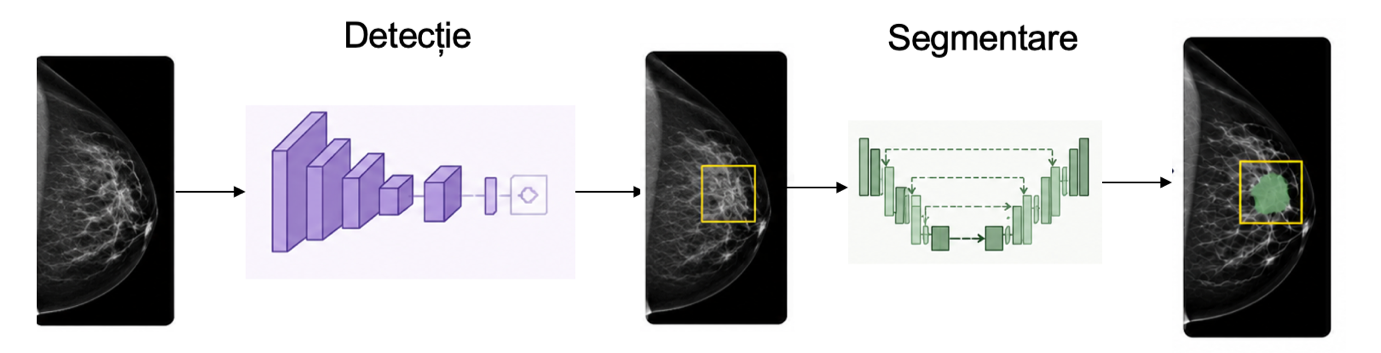
Fig. 1. Mammography segmentation pipeline
The research is based on two public datasets with complementary characteristics:
- InBreast — dataset containing relatively large lesions
- CBIS-DDSM — dataset with smaller lesions
To increase model robustness, data augmentation techniques were applied, including rotations, zoom, and normalisation.
The two pipeline steps are implemented using the YOLOv10 model (detection) and a U-Net with ResNet34 encoder (segmentation).
2. Example Results
2.1 Single-lesion case
Segmentation without prior detection produces imprecise or incomplete results, incorrectly marking healthy areas (Fig. 2 left) or missing lesions entirely, whereas applying the proposed pipeline yields correct analysis of the mammogram (Fig. 2 right).
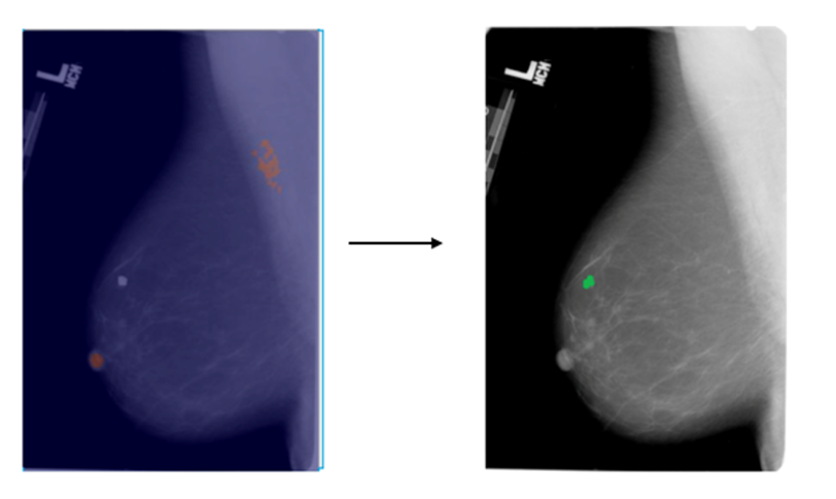
Fig. 2. Left — direct segmentation with incorrect result; Right — detection and segmentation pipeline with correct result
2.2 Multiple-lesion case
In the image shown in Fig. 3, applying the proposed pipeline identifies and segments a single lesion (the lesion outlined in red).
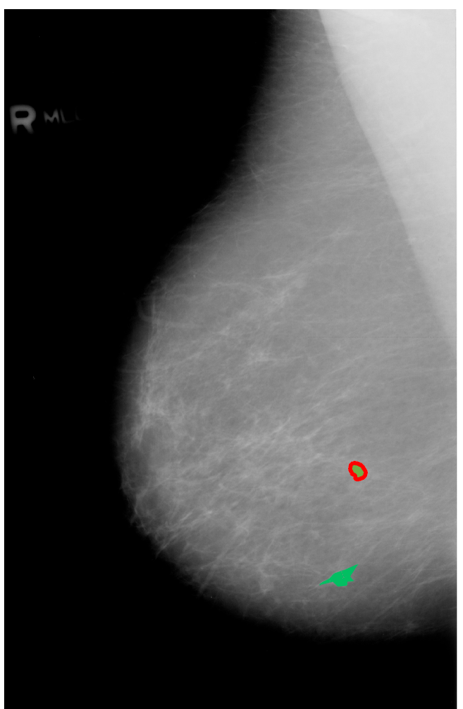
Fig. 3. Mammogram in which a single lesion is segmented using the detection and segmentation pipeline
To locate lesions not identified by the pipeline, explainability mechanisms have been introduced via Grad-CAM (Gradient-weighted Class Activation Mapping). The integration of explainability serves two complementary objectives:
- Decision transparency — the clinician can verify which regions of the mammogram drove the model's prediction
- Detection of missed lesions — the Grad-CAM activation map can highlight high-activation areas not covered by the proposed pipeline
Based on the activation map, a new image crop is generated and segmentation is applied to it, enabling detection and segmentation of the second lesion as well (Fig. 4).
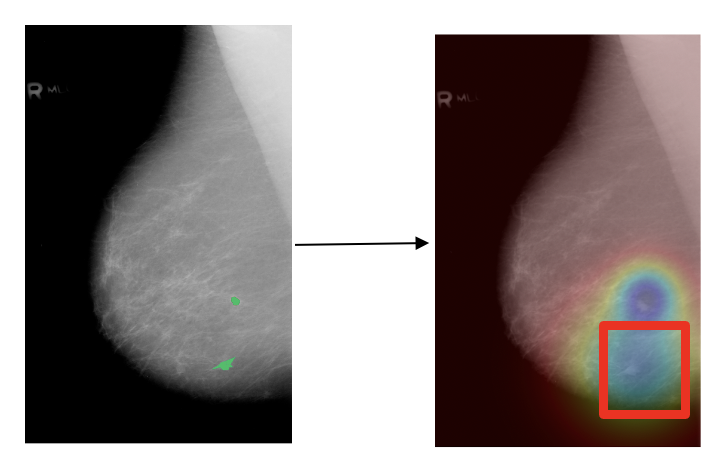
Fig. 4. Lesion identified based on explainability results
